
Dashboard
The Tunely dashboard is the central management surface for a namespace. It is where agents are created, agent tokens are issued, and the services assigned to each agent are configured. A service represents a local application that an agent can reach from the private network and publish through a Tunely address.
Configuration changes are managed centrally in Tunely and then delivered to the agent runtime. The agent applies the latest service, tunnel, and certificate state locally and reports back whether that configuration is current. This makes the dashboard the first place to check which agent is responsible for which services and whether the expected configuration has actually reached the local installation.
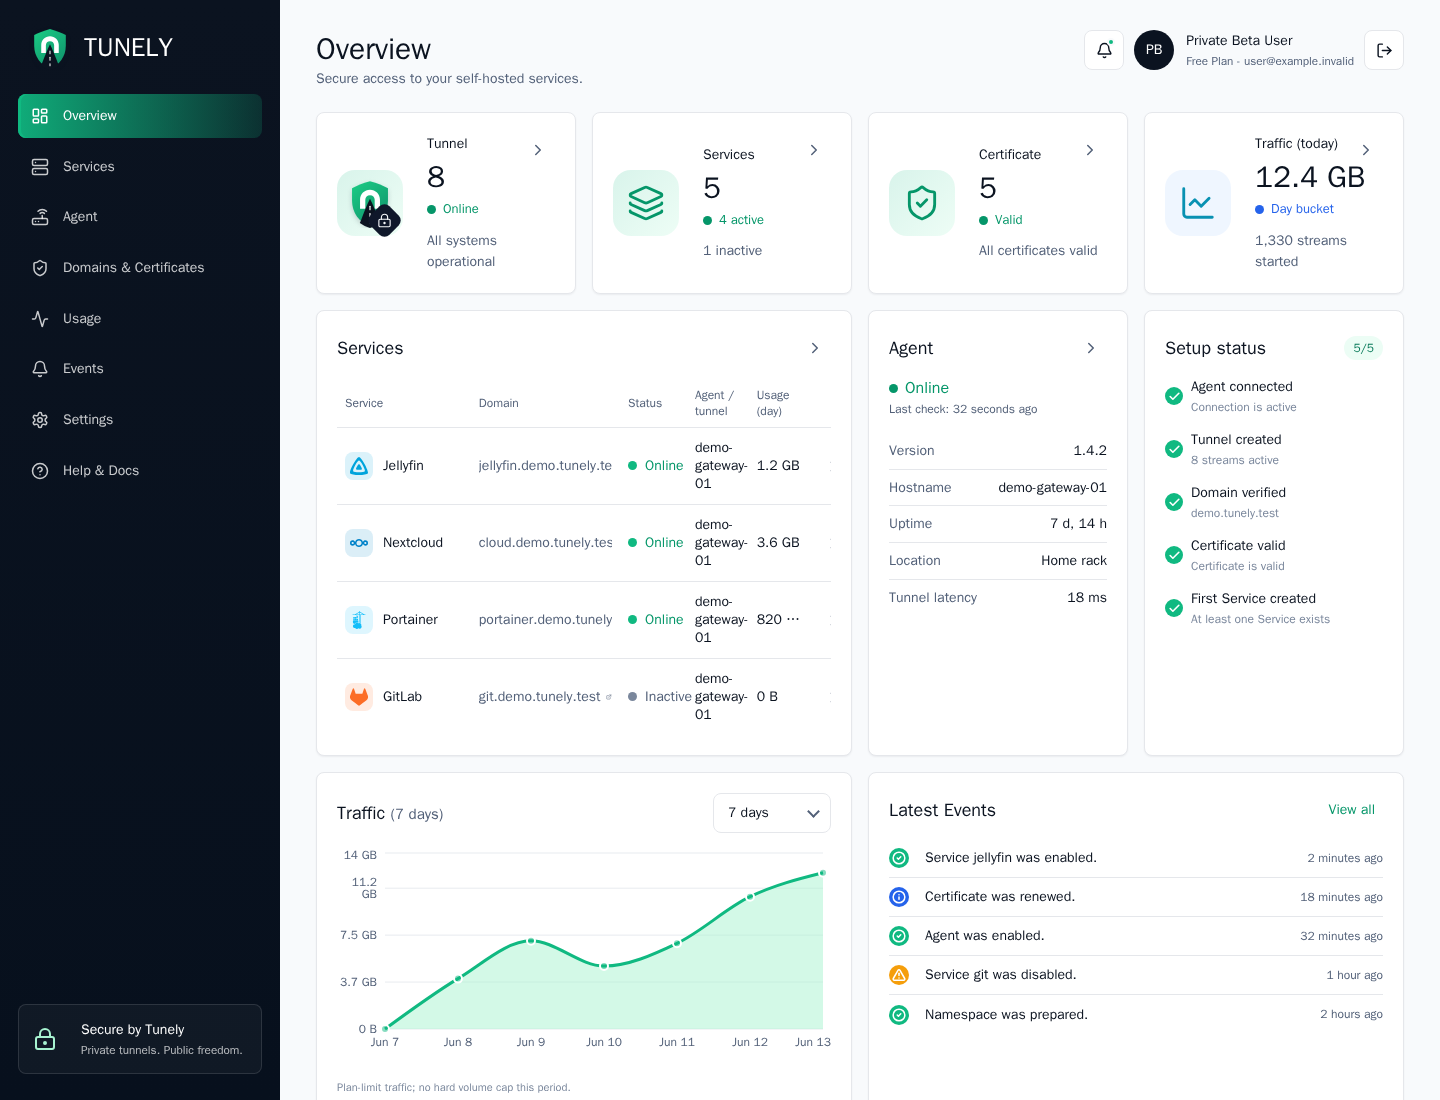
The dashboard also provides an operational status overview. It brings together agent health, tunnel connectivity, service state, certificate readiness, active streams, usage counters, plan limits, setup progress, and recent events. Use it to spot disabled services, stale agent reports, pending configuration changes, traffic or stream anomalies, and DNS, certificate, or routing problems before opening the detailed Agent, Services, Usage, or Events views.
Sections
| Section | Purpose |
|---|---|
| Overview | Fast status for the namespace, agents, services, certificates, and events. |
| Agents | Create agents, use tokens, inspect status, and remove installations. |
| Services | Configure local applications as Tunely services. |
| Domains | Review Tunely addresses and later custom domain assignments. |
| Usage | Understand traffic, connection, and technical usage signals. |
| Events | Review changes, errors, and security-relevant activity. |
| Settings | Review namespace, account, plan, and prepared notification areas. |
Layout
The left navigation is the main way to move through the dashboard. It keeps the core operational areas visible: Overview, Services, Agent, Domains, Usage, Events, and Settings.
The top-right account area shows the current user, plan, notification entry point, and logout action. The footer shows product links and the current Private Beta status indicator.
Overview Cards
The top cards are designed for fast status checks:
| Card | Meaning |
|---|---|
| Tunnel | Current tunnel and stream state for the namespace. |
| Services | Number of configured services and how many are active. |
| Certificate | Certificate readiness for the namespace domain. |
| Traffic | Current traffic counter for the selected dashboard period. |
Below the top cards, the dashboard highlights service state, agent state, setup completion, recent usage, and latest events. Use the overview first when you want to answer: "Is my namespace healthy right now?"
Typical First Checks
- Confirm that the tunnel card is online.
- Confirm that the agent panel shows the expected agent.
- Review the services table for warnings or disabled services.
- Check setup status and latest events when something changed recently.